 Studios
-
 Support
 -
 Contact us
 -
 News
News -
 Products
 -
0
 Cart
Cart

Studios
Support
Contact us
News
Products
Cart Monitoring Studio is GUL’s data management, analytics and visualisation platform for guided wave monitoring systems. Designed to integrate seamlessly with the gPIMS® system Monitoring Studio brings sensor data, asset information, monitoring results and supporting documentation together in one accessible workspace. Its analytical tools transform complex guided wave data into clear information that supports condition assessment and informed maintenance decisions.Monitoring Studio is available as either a GUL-hosted cloud service or a customer-hosted Local Node, allowing organisations to select the deployment model that best meets their operational, security and data-governance requirements.
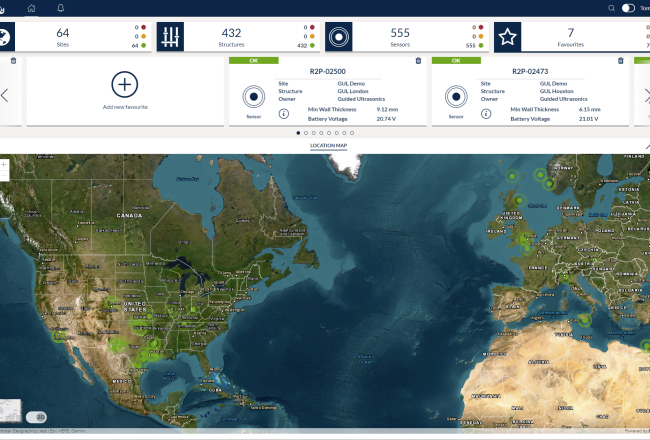
The cloud-based Software-as-a-Service (SaaS) version provides authorized users convenient browser-based access to the Monitoring Studio Cloud . A user’s access can be controlled to serve up monitoring information from individual sensors, structures, sites, or organizational divisions.
GUL manages the SaaS, which is hosted on reputable platforms such as Microsoft Azure, allowing customers to use the Monitoring Studio without maintaining a dedicated on-premises server.
The Local Monitoring Studio is installed on a dedicated server on the customer’s premises.
All monitoring data is stored within the customer’s local environment, giving the organisation direct control over its data, infrastructure, access policies, backup arrangements and retention requirements.
Authorized users can access the Local Monitoring Studio through a standard web browser in the same way as for the cloud-based version, without the need for dedicated software to be installed on individual users’ computers.
 Map view and navigation
Easily find individual sensors on a map or navigate to sensor data by selecting individual sites and structures
TimelineA key function of the data management service, it is designed to provide a historical record of events for the asset being monitored. Download data files from here, log events or upload reports, images, drawings and any other related information about the asset. You can also get notified each time a data file is uploaded.
Small area monitoringShows temperature compensated wall thickness data locally at the sensor position, covering the entire circumference of the pipe. Corrosion rates can be evaluated manually or, for automated systems, calculated automatically.
Large area monitoringAvailable for automated systems, it features a trend map for easy identification of changes in large area monitoring data over time. Highlight and log changes that need tracking over time.
System informationHave all the information in one place, including temperature of the pipe at the sensor location, battery status displays. Custom wall thickness and area monitoring thresholds can be defined for each sensor.
The Monitoring Studio is available in three service packages with increasing functionality:
 PAYG
PAYGa pay as you go style package suitable for repeat inspection and scheduled monitoring applications. Pay only for the files you want processed, while taking advantage of free hosting of the data and files you upload in the timeline.
 BASIC
BASICan annual subscription suitable for scheduled monitoring applications or as a cost-effective solution for automated monitoring applications where Large area monitoring analytics is not required.
 ADVANCED
an annual subscription for automated monitoring applications. Our most powerful package featuring full automation.
The Monitoring Studio local come with one license
ADVANCEDThe Local Monitoring Studio is provided with an Advanced service package as standard.
| Subscription | PAYG | BASIC | ADVANCED |
|---|---|---|---|
Collection type that this package is best suited to | Scheduled | Scheduled/Automated | Automated |
Fee structure/sensor | Per processed file | Annual fee | Annual fee |
| Data management | |||
Upload of data files1 |
 |
|
|
Storage and back-up |
|
|
|
Download2 |
|
|
|
Web-based access to with map view |
|
|
|
Timeline view with import and export of meta-data (reports, images, etc.) |
|
|
|
Data export into historians |
 |
|
|
| Data analytics and visualization | |||
Data validation |
|
|
|
Temperature values |
|
|
|
Wall thickness values |
|
|
|
Wall thickness manual corrosion rate analysis |
|
|
|
Wall thickness automated corrosion rate analysis |
|
|
|
Area monitoring manual baseline comparison3 |
|
|
|
Area monitoring trend map (A-Scan view) |
|
|
|
Area monitoring trend map (residual view) for change detection and tracking |
|
|
|
| Data service support | |||
Access to helpline4 |
|
|
|
1. Requires local installation of GUL Uploader program included in the software package
2. Via web browser
3. Data analysis carried out in WavePro software, with license delivered via Studio synchronisation
4. Details provided in Studio Service Level Agreement (SLA)


